jet
Mobile Web Inspector Developer Tools
What is a web inspector?
A web inspector is a developer tool that allows you to debug JavaScript, CSS, and HTML. You’ll usually get a file resource browser, performance monitoring tools, the ability to set code breakpoints (although in my experience breakpoints are somewhat flaky depending on which version of the mobile OS and desktop browser you are using–so often I resort to using the JavaScript “debugger” keyword to act like a breakpoint), the ability to edit HTML, and a tool for visualizing, resolving, and changing style properties–all without having to redeploy your application.
Apple introduced the ability to use the desktop Safari web inspector developer tools with iOS application WebViews and mobile Safari back in iOS 6 and Safari 6. Each new release of iOS has required that you use a corresponding version of desktop Safari so beware of this if you are planning to upgrade one device but not the other.
Google introduced the ability to use the desktop Chrome web inspector developer tools with Android application WebViews and mobile Chrome in Android 4.4 when the Chrome WebView was introduced. Many legacy Android devices are still being sold (let alone in use) but unfortunately, it is not compatible with the web inspector. For situations like that, there are some third party techniques available that require you to inject code into your application in order to send messages back and forth with a server. Those solutions have much fewer abilities than a formal web inspector. To combat this legacy issue, Google introduced a Google Play-updatable WebView in Android 5 Lollipop so your application can take advantage of new technologies even if the OS is not upgradeable.
Regardless of the platform, it is important to note that the WebView and the mobile browser are not equal. If something works in the browser, you cannot always expect it to work exactly the same way in the WebView. For example, on Android, I have seen as much as a major version number difference of 3 between the two. On iOS (prior to WKWebView), JavaScript performance was severely throttled compared to what mobile Safari had.
This post only discusses web inspectors. If you are interested in debugging Java code for your application, refer to the Oracle MAF developer guide for instructions.
Setting up your Oracle MAF Application
For iOS, there is no property to edit, you either need to use a debug deployment or use Xcode to run the application. For Android, you must edit the src/META-INF/maf.properties file of your application so that it defines:
javascript.debug.enabled=true
You can only use a web inspector with development (aka non-production) applications.
If you want to connect the web inspector before the first screen loads, will need to edit your run configuration’s “Application Arguments” to specify the following which allows you to configure how many seconds before the WebView will get populated with content.
-featureContentDelay 20
If doing this in an already-generated Xcode project, this setting goes in the Run Scheme’s “Arguments Pass On Launch” field.
Setting up your Desktop Browser
I assume that you already have your device set up for development so I won’t cover it here (e.g. Android needs development mode and USB debugging turned on via tapping the build number 7 times, iOS needs the device set up as “Use for development”, etc.).
Desktop Chrome doesn’t require anything special but I use this optional “ADB” Chrome extension as a convenience since I find it easier to click an icon vs. typing a special URL in the address bar.
Desktop Safari requires you to enable the “Develop” menu in its Advanced Preferences dialog:

Using the Safari Web Inspector
From the Safari Develop menu, your connected devices and iOS Simulator will display as submenus. Each submenu will list all of the WebViews that you are allowed to inspect (if you are not sure which one you want, a light blue highlight will appear on your device or in the simulator as you hover over each menu item).

A web inspector window will open once you select that menu item:
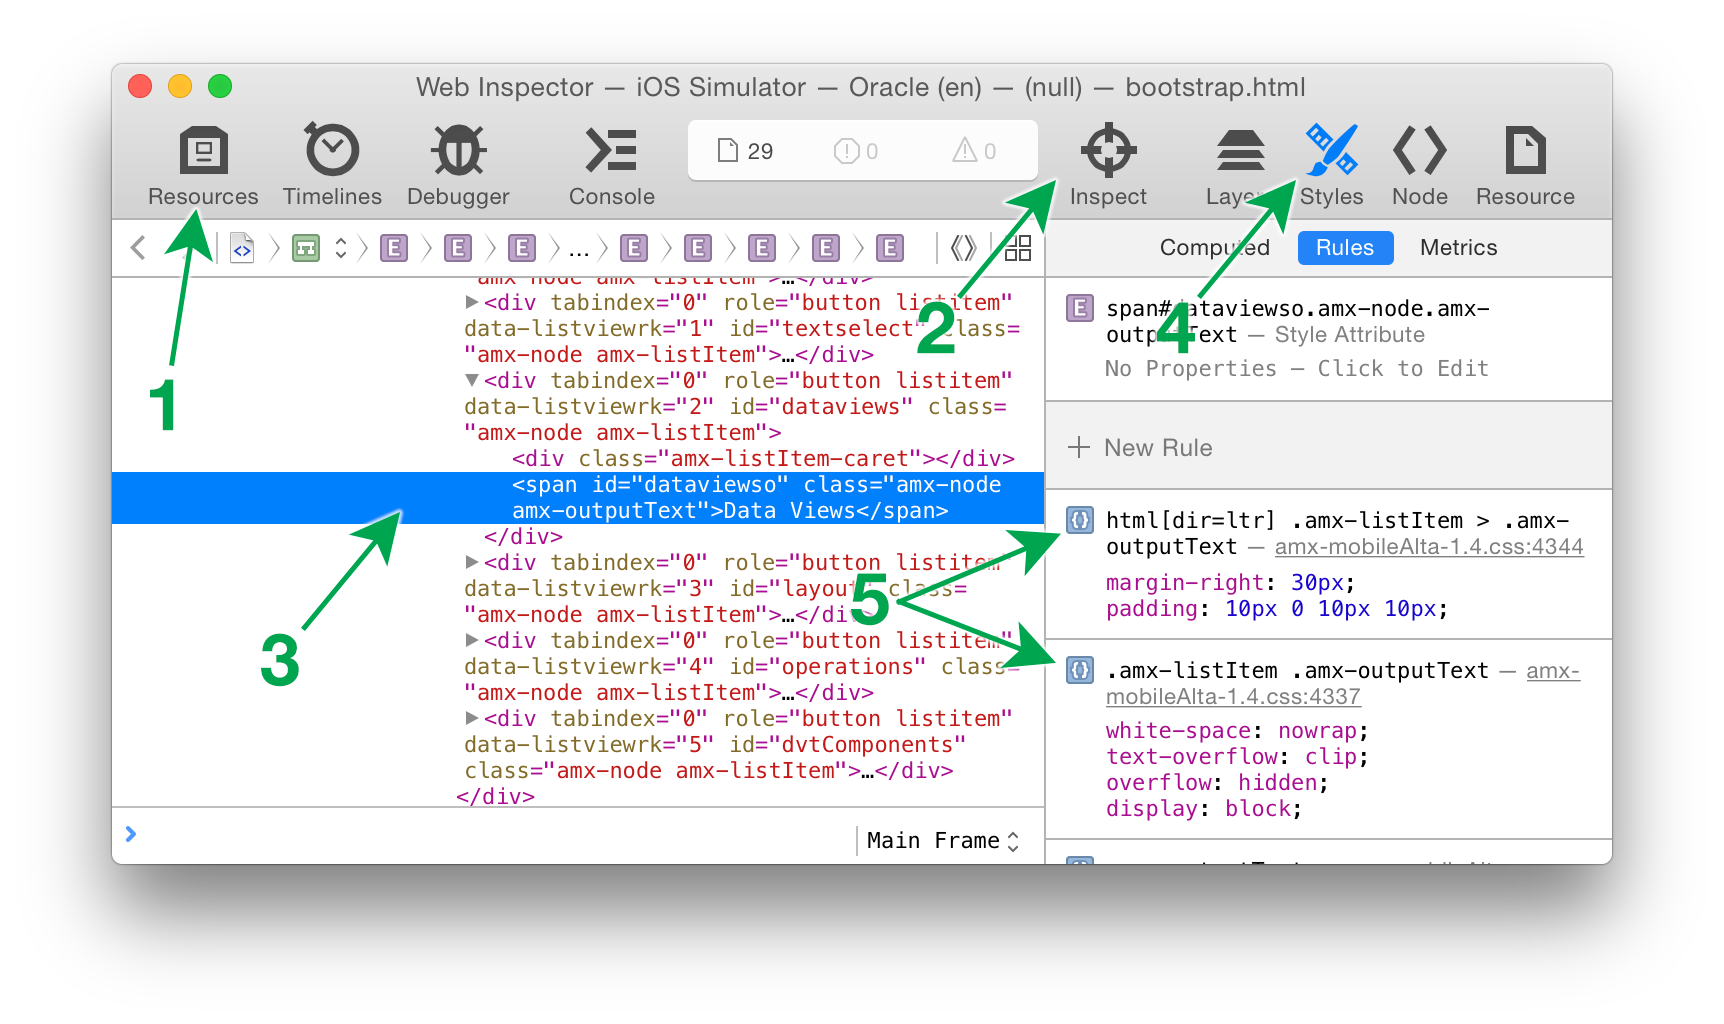
The UI varies across versions of desktop Safari but I’ll describe one here as an example. The “Resources” tab (1) is where you can browse the DOM, look at scripts, style sheets, etc. When the HTML resource is selected, the main panel will show you the DOM tree (3) which you can manually browse for an element. Alternatively, you can use the crosshairs tool (2) to click on the screen (of the actual device or the simulator) to pick an element that you want to inspect.
With an element selected, you can then use the “Styles” tab (4) of the right panel to view the element’s style properties. This will show you the exact selectors that are providing each style to the inspected element (5). This is incredibly valuable, particularly when multiple selectors are competing (a line will strike out any styles that lose out due to some other more specific selector). You can also edit those values directly or add additional properties and see the change immediately take effect on the screen. Beware changes made in the inspector do not get saved permanently into your application. If you are trying to create a custom style sheet, you’ll need to jot down elsewhere the changes you’ve made; if you leave the page or close the app, you’ll lose your changes.
Using the Chrome Web Inspector
First, visit Chrome’s “chrome://inspect/#devices” page to see a list of your connected and debuggable Android devices. Each will appear with all of the WebViews that you are able to inspect. An icon will appear with a darker gray and the WebView listed towards the top will be what is currently visible on the Android screen.
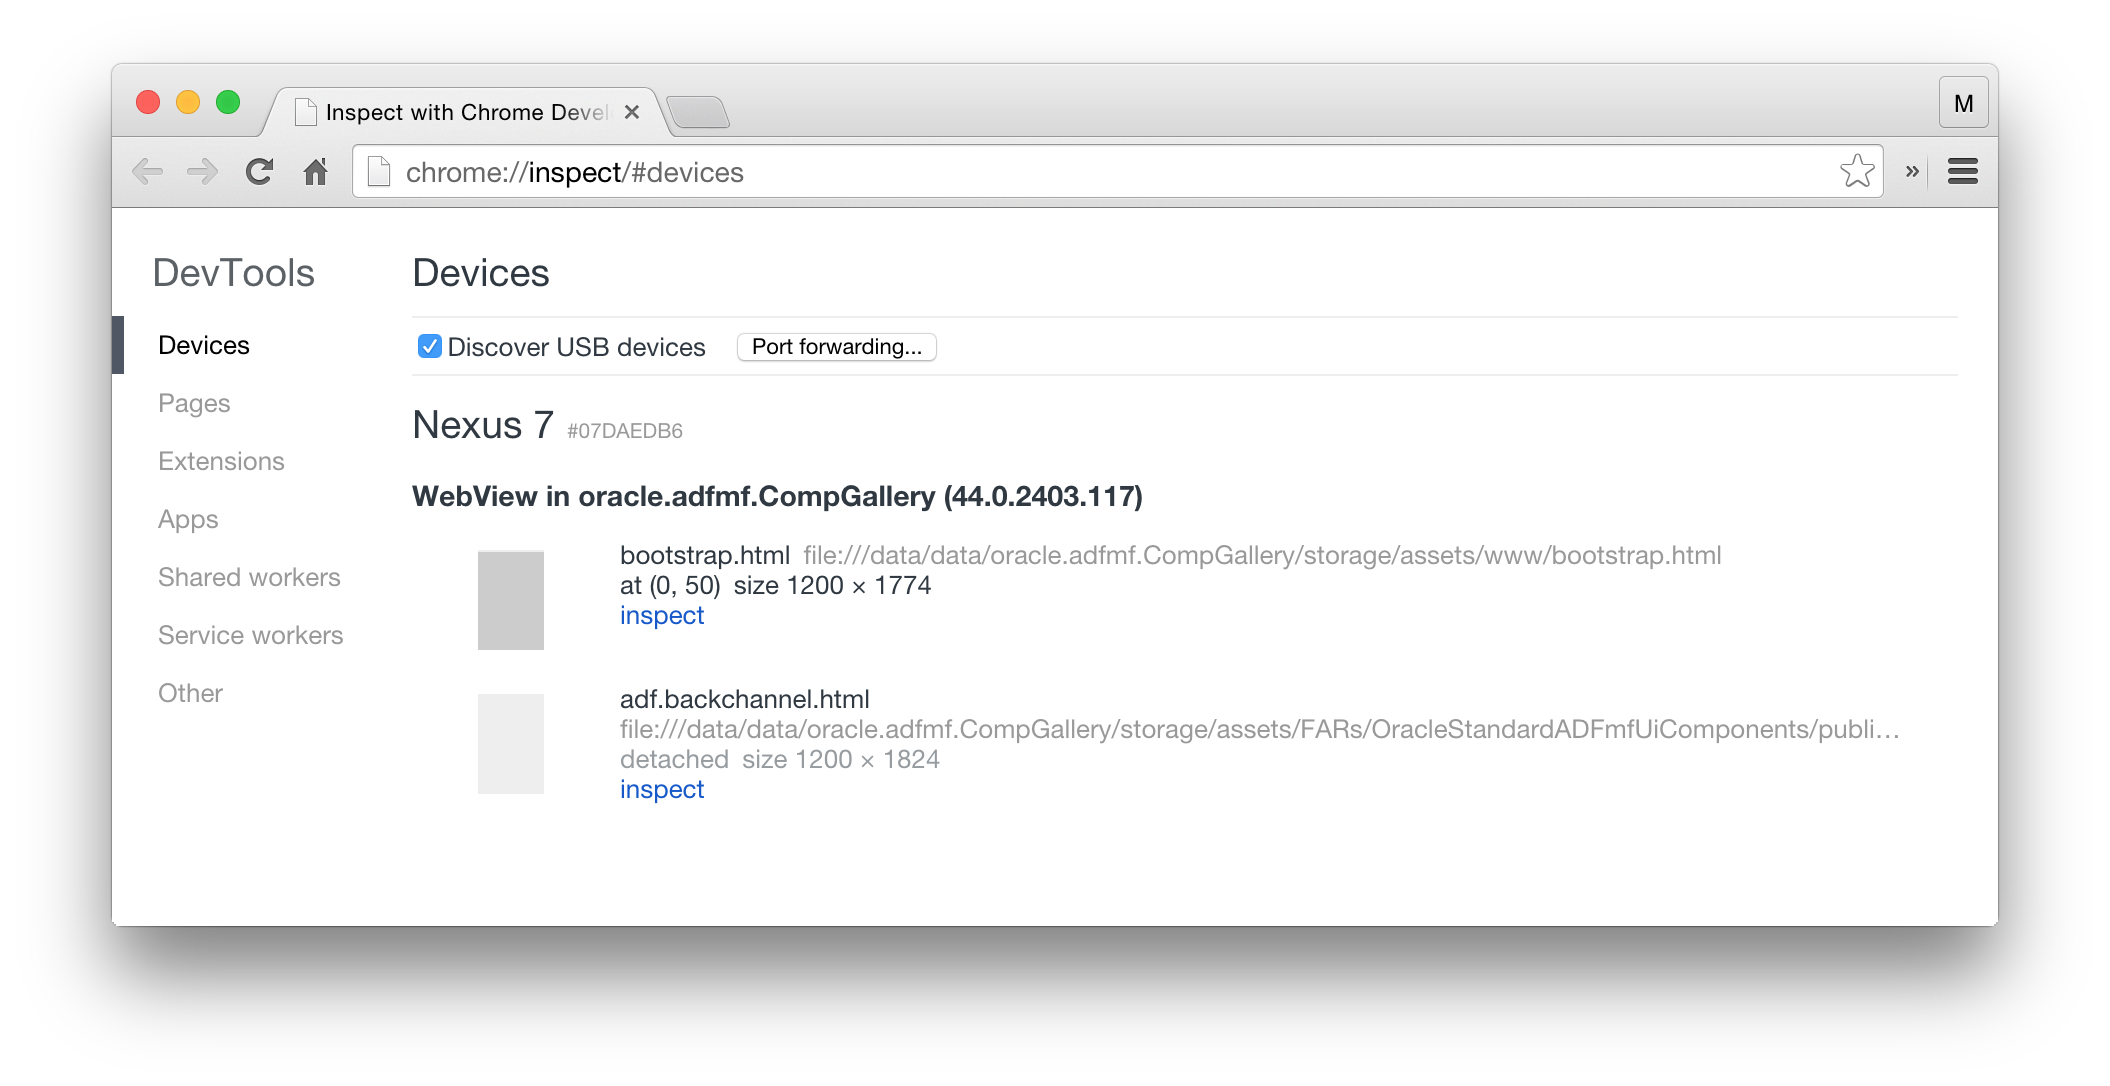
A web inspector will open once you click the “inspect” link.
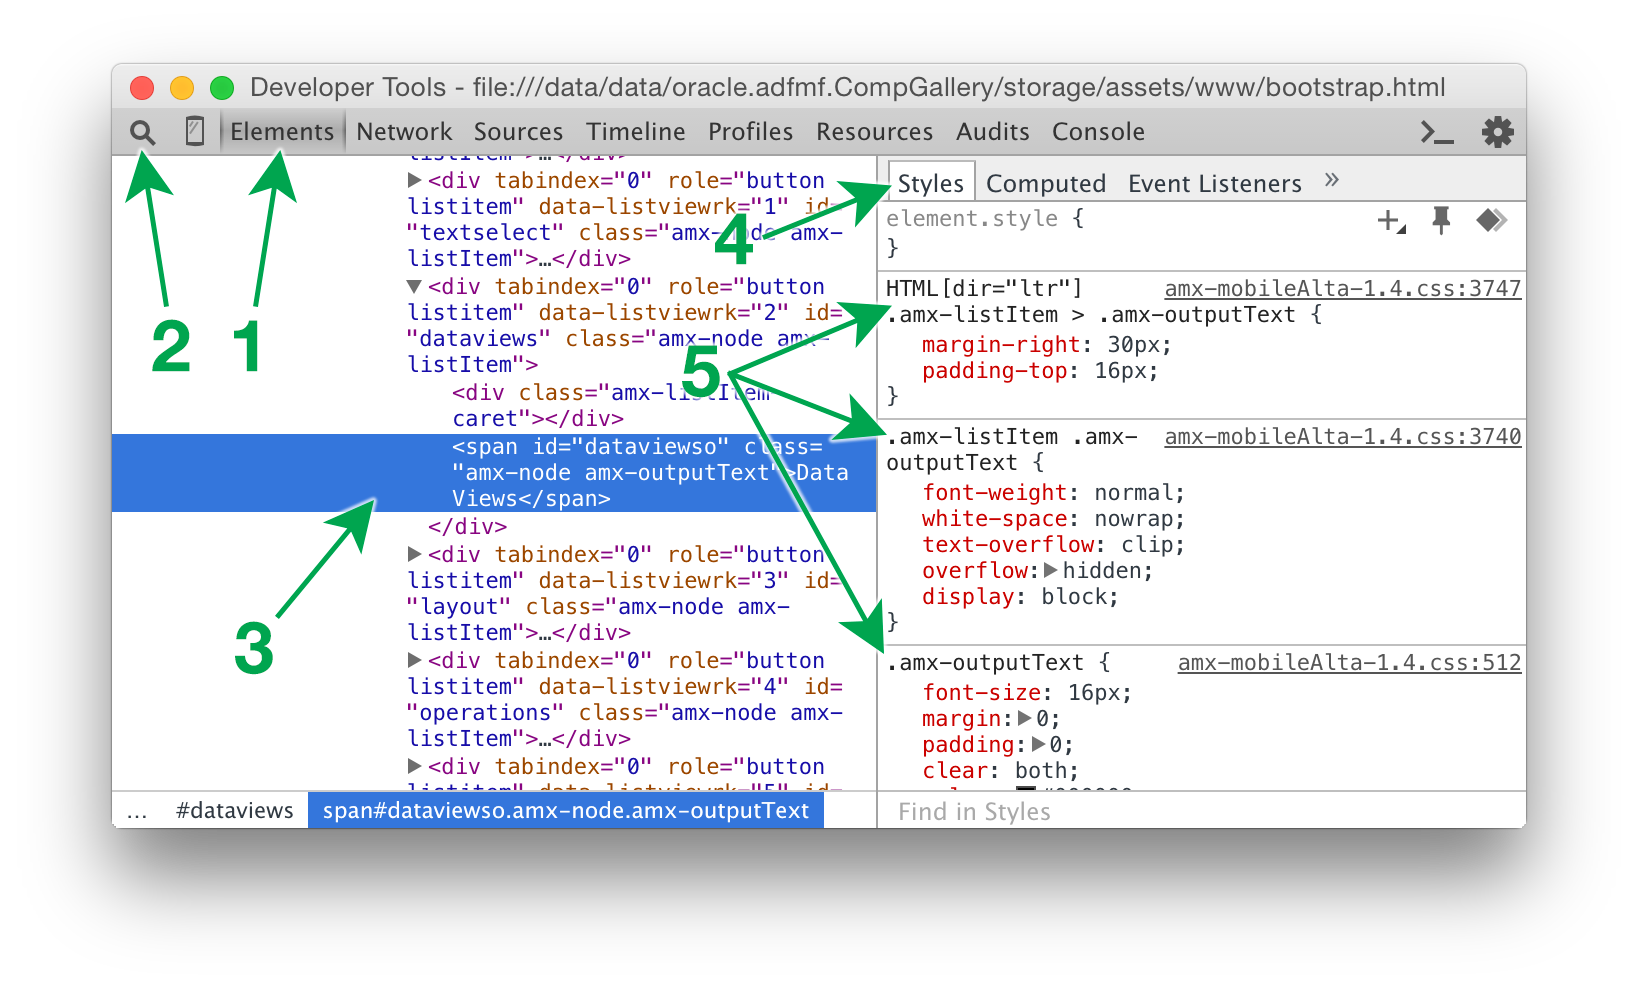
The UI varies across versions of desktop Chrome but I’ll describe one here as an example. The “Elements” tab (1) is where you can browse the DOM. The main panel will show you the DOM tree (3) which you can manually browse for an element. Alternatively, you can use the magnifying glass tool (2) to click on the screen (of the actual device or the emulator) to pick an element that you want to inspect.
With an element selected, you can then use the “Styles” tab (4) of the right panel to view the element’s style properties. This will show you the exact selectors that are providing each style to the inspected element (5). This is incredibly valuable, particularly when multiple selectors are competing (a line will strike out any styles that lose due to some other more specific selector). You can also edit those values directly or add additional properties and see the change immediately take effect on the screen. Beware changes made in the inspector do not get saved permanently into your application. If you are trying to create a custom style sheet, you’ll need to jot down elsewhere the changes you’ve made; if you leave the page or close the app, you’ll lose your changes.
Further Reading
https://github.com/phonegap/phonegap/wiki/Debugging-in-PhoneGap
iOS Web Inspector
The content of this post has been updated with additional detail at:
https://formattc.wordpress.com/2015/08/21/mobile-web-inspector-developer-tools/
